What happens with Ground Penetrating Radar data after a survey?
Published on by Alex Hardy
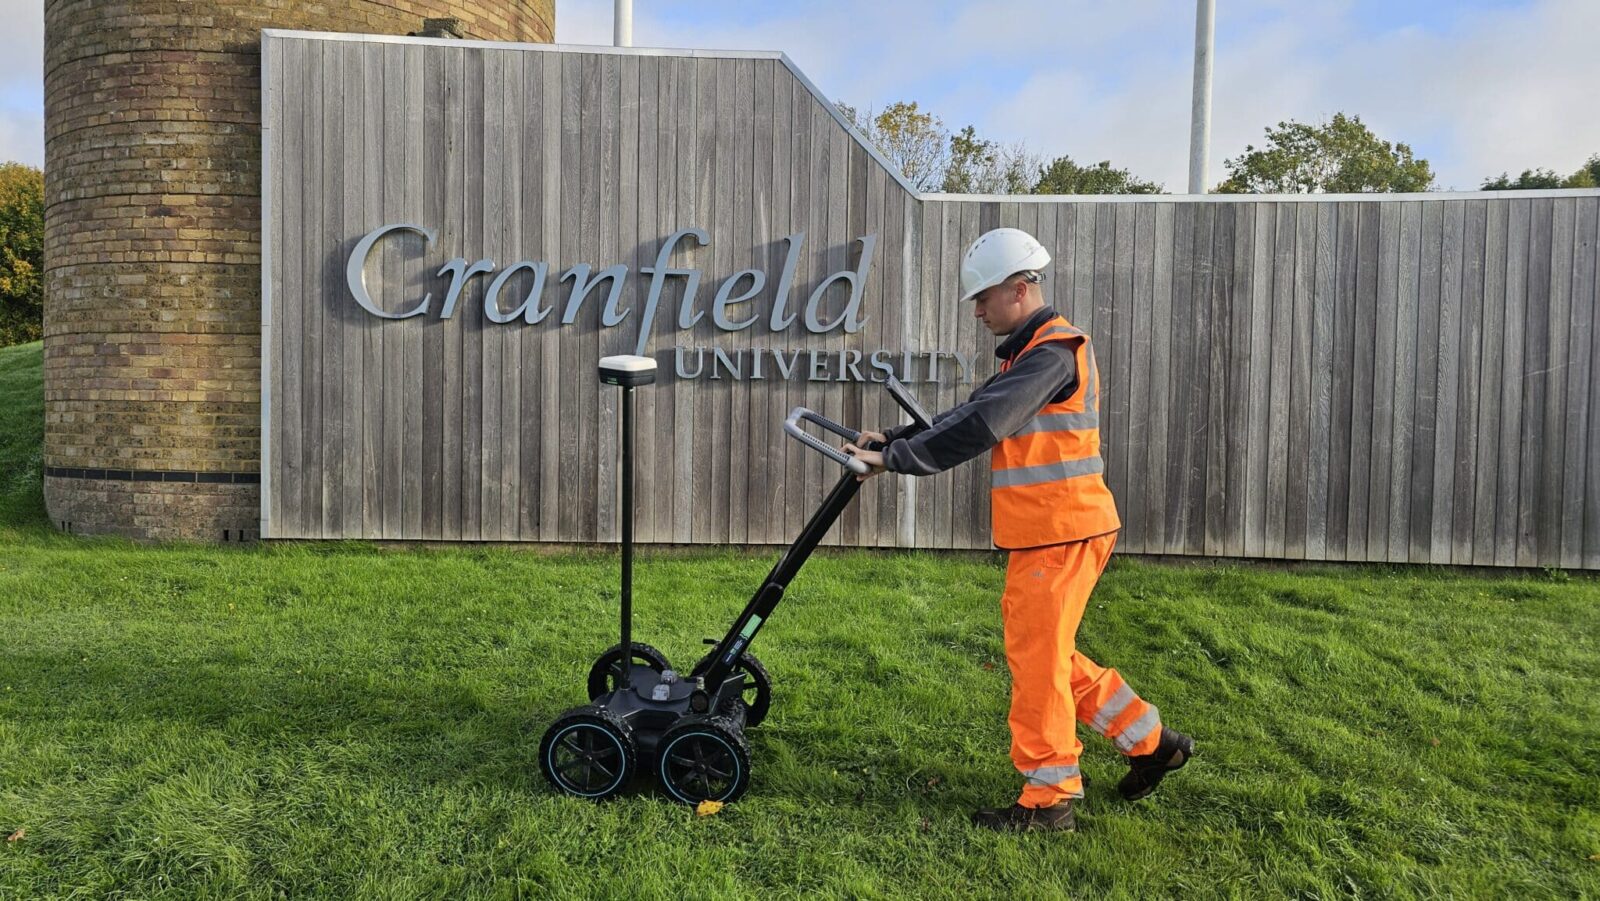
What happens with the ground penetrating radar data after the survey? Ground penetrating radar (GPR) uses radio waves to create images of the sub-surface by sending signals into the ground using multiple antennas that can either be pulled by hand or attached to a vehicle.
Ground penetrating radar (GPR) uses radio waves to create images of the sub-surface by sending signals into the ground using multiple antennas that can either be pulled by hand or attached to a vehicle. When a wave hits anomalies underground, the radar measures the amount of time it takes for the wave to return and turns this information into reviewable data to show what is below the surface. This non-invasive geophysical technique uses radio waves to create images of the sub-surface by sending signals into the ground using multiple antennas that can either be pulled by hand or attached to a vehicle. When a wave hits anomalies underground, the radar measures the amount of time it takes for the wave to return and turns this information into reviewable data to show what is below the surface.
This non-invasive geophysical technique is commonly used when carrying out underground utility surveys as services can be detected by generating a continuous cross-sectional image of subsurface features without the need for drilling, probing, or excavation. This minimises the disruption to the surveyed area while reducing the time and cost associated with invasive survey methods.”>underground utility surveys as services can be detected by generating a continuous cross-sectional image of subsurface features without the need for drilling, probing, or excavation. This minimises the disruption to the surveyed area while reducing the time and cost associated with invasive survey methods.

GPR data can be viewed instantly while scanning at speeds up to 22 mph (35 km/h). It can reach depths of 33 ft (10 m), but in average soil, it typically goes about 12 ft (3.7 m). A small metal object, as small as 0.4 inches (10 mm), can be detected up to 12 inches (300 mm) deep.
While GPR data collection is important, the real value comes from post-processing, as the raw data often contains noise and background interference that can obscure important features. Post-processing involves manipulating and analysing raw GPR data to extract essential information, to give our clients insight into the features and risks on their site. For some anomalies, interpreting GPR data can be achieved with basic training, although the complexity of the data determines the level of experience required to understand and draw more accurate conclusions.
During post-processing, errors from incorrect positioning or calibration in some collected data can be fixed, as the equipment’s position, timing, and signal strength can be adjusted to improve accuracy of the data collected.
GPS or reference markers are often used to help correct the data, making it more reliable for tasks like accurately mapping underground utilities and structures. We also use algorithms to enhance subtle features that are not immediately obvious in the raw data. They remove noise, sharpen reflections, and improve clarity to make underground features easier to find, like buried utilities, building foundations or soil changes. This helps make the data clearer and easier to understand for the range of stakeholders who will go on to use the results from our surveys.
The Utilities teams at Survey Solutions deliver reliable, industry leading data, whilst following the latest industry standards. Providing clear, actionable reports, we present data in easy-to-understand formats, helping our clients make confident, data-driven decisions.
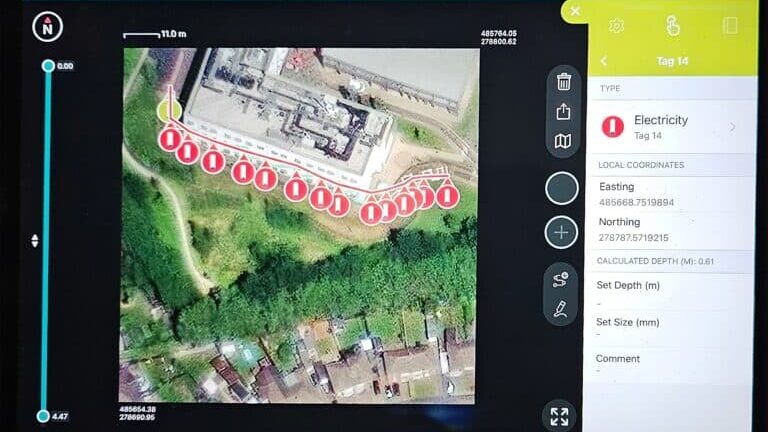
This picture shows electric cables were located using GPR post-processing techniques, with each tag indicating depth, eastings, and northings.
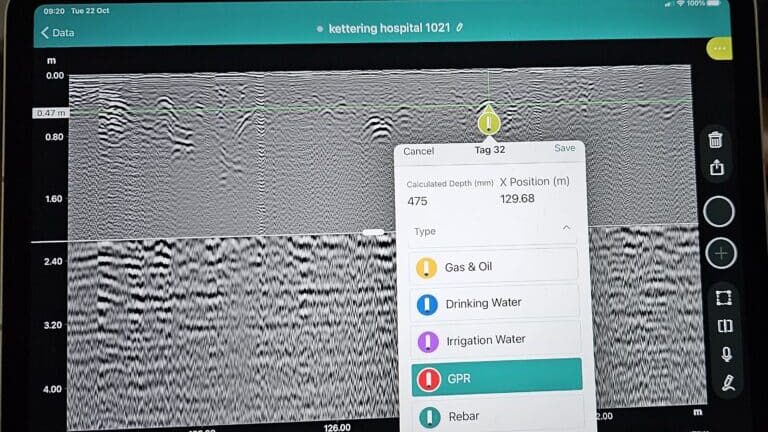
This image shows how the data is processed to pinpoint anomalies, and tags are added to obtain depth information.
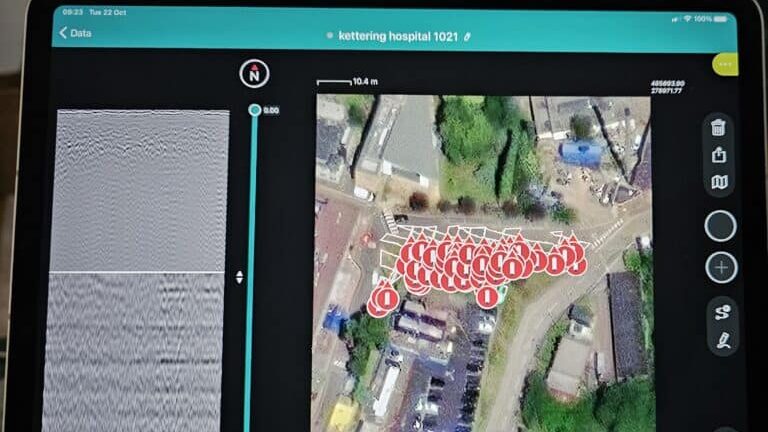
This image shows a densely concentrated area where numerous anomalies have been identified.
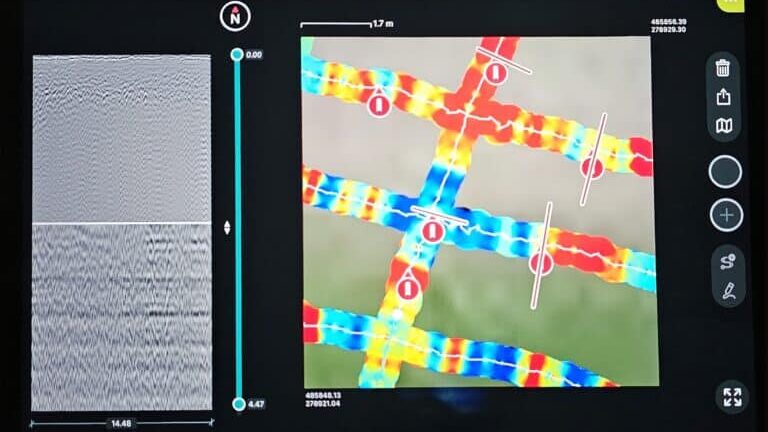
This image shows the annotation lines to indicate the direction in which anomalies are detected.
Our service is renowned the construction industry, for prioritising accuracy and transparency to reduce the risks for our clients on their site work. We ensure we keep our client informed throughout the process. A testimonial we received for a recent utilities survey at Thurrock Retail Park says:
“I wouldn’t hesitate to recommend Survey Solutions. Not only were they incredibly responsive, getting back to me by telephone and email to help define the project’s requirements, but they also offered the most favourable lead times. Their ability to use a vehicle to conduct the surveys on the roads, meant we didn’t have to go to the trouble and expense of implementing a traffic management system, which was a huge relief.”
Interested in learning more? Arrange a CPD with our team, who can explain this in further detail and answer any questions.